

Uptime Monitor
Keep every server and service you run under watch, straight from your NIZU workspace. Uptime Monitor checks your infrastructure on the schedule you set, alerts you the moment something goes down, and tells you again when it comes back up.

Features
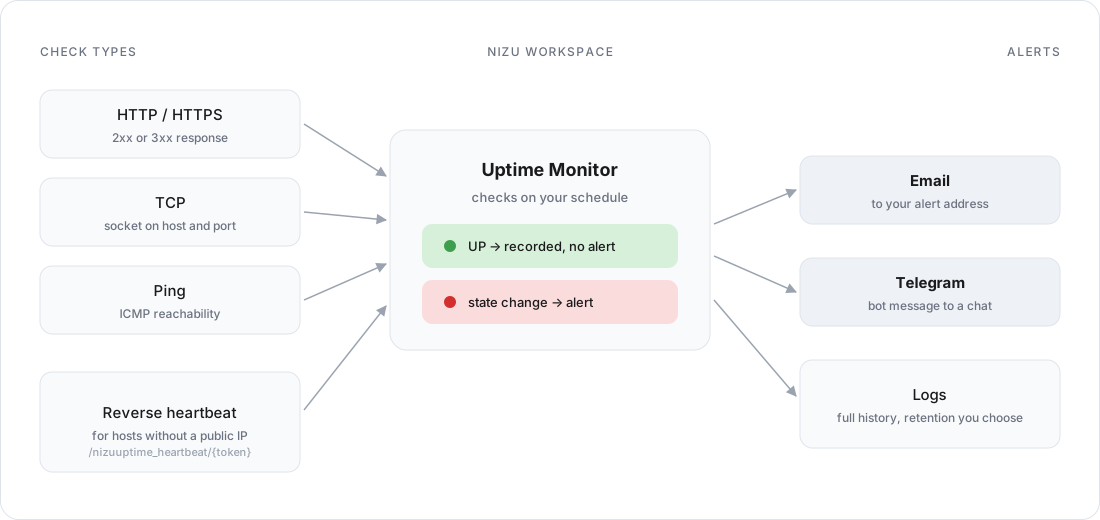
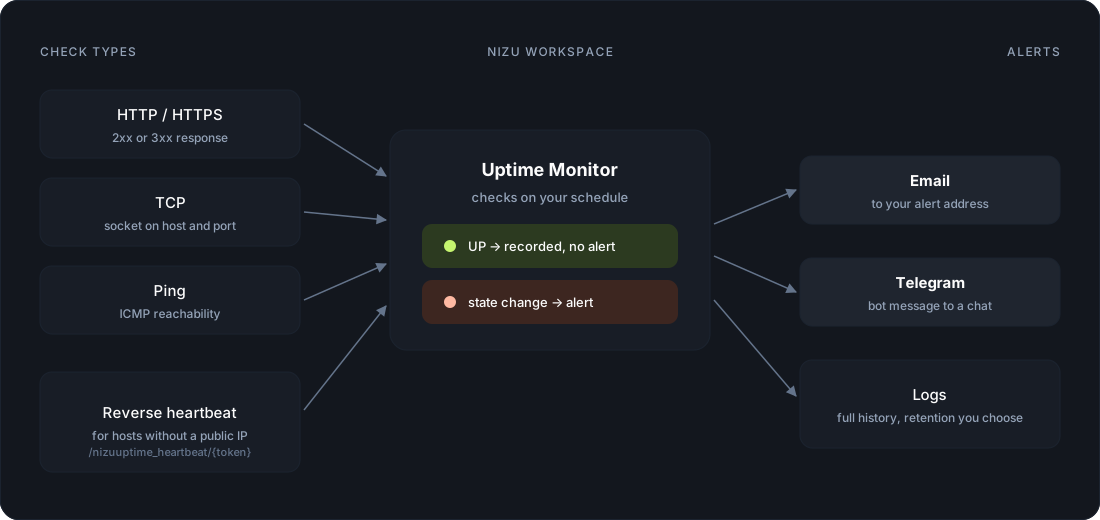
Every check runs on the schedule you set. Status and response time are recorded and compared with the previous state, so an alert only fires when something really changes. Your team gets notified, not spammed.
HTTP and HTTPS checks
Request any public URL and confirm it answers with a healthy 2xx or 3xx response.
TCP port checks
Open a raw socket against a host and port to verify that databases, mail servers and other services still accept connections.
Ping checks
Send an ICMP ping to confirm a host is reachable, even when it serves nothing over HTTP.
Reverse heartbeat
Machines behind NAT or without a public IP push their own status to a unique heartbeat URL. If the beat stops, you know straight away.
Alerts on state change
Email and Telegram notifications fire only when a server switches between up and down. Both channels can be tested from Settings, without waiting for a real incident.
Dashboard and logs
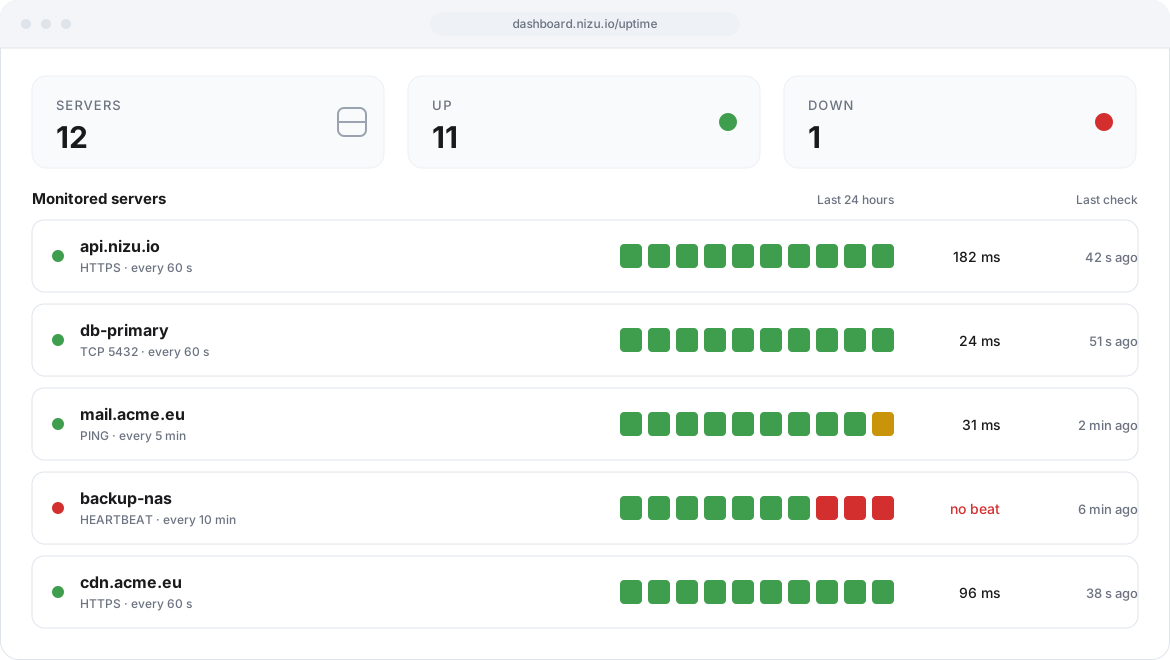
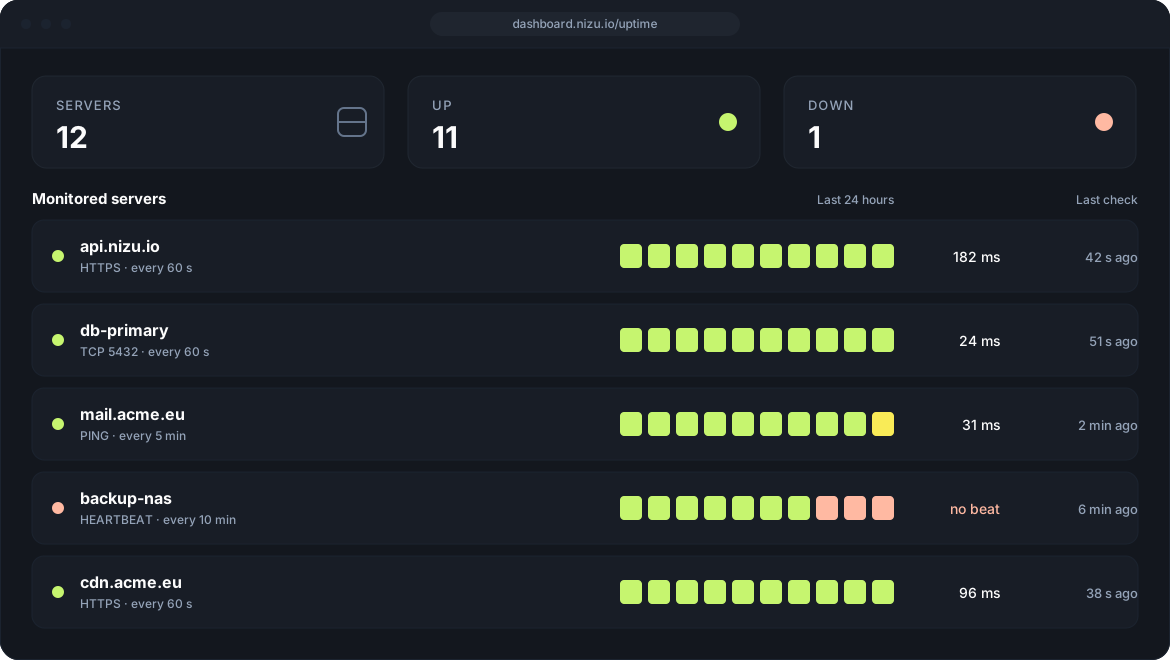
See how many servers are up or down, a 24-hour uptime bar for each one, response times, and the full history of every check.

Connected Apps
No App works alone
Checks, alerts and history live in the same workspace as the rest of your apps:
-
Three check types: HTTP and HTTPS, TCP and ping
-
Reverse heartbeat for hosts without a public IP
-
Email and Telegram alerts, testable from Settings
-
A 24-hour uptime bar and response time for every server
-
Full check history with the retention period you choose